IDENTIFYING ULTRASOUND CART DISCREPANCIES IN OB REPORT VALUES
QUICK OVERVIEW: 5 TAKE-AWAYS
PLEASE READ THESE 5 TAKE-AWAYS BEFORE CONTACTING CLICKVIEW
- CLICKVIEW Departmental Reporting Systems are ‘Correct’. CLICKVIEW has been selected by Radiology Management to improve the quality of ultrasound reporting by using standardized formulas to calculate uniform OB reports across all US Carts in the Department. The formulas and values calculated by the CLICKVIEW Reporting system have been approved by Radiology Management and are therefore the ‘Correct’ calculated values for all OB reports for ALL US Carts in the Department.
- It’s the Cart Formulas! When there are material discrepancies from CLICKVIEW in GA, FW, EDD, and Fetal Growth Chart percentiles calculated by the US Cart, it is because the US Cart is using different formulas. For example, there are multiple different ‘Hadlock’ formulas in the medical literature. Simply saying it is a ‘Hadlock formula’ is not enough.
- Check the Source Articles. Identify the source reference article from which the formulas on the US Cart are derived and compare them to the reference articles from which the CLICKVIEW formulas are derived. It is essential to compare reference articles, authors, and dates published from which the formulas were derived.
- Ask for IT Support. Keep in mind that minor discrepancies (GA days, EDD dates, Percentiles, etc.) can occur due to rounding errors or statistical post-processing of the original data by the US Cart formulas. This can include ‘smoothing’, ‘Z,’ or Log transformations. IT can often determine the source of minor discrepancies.
- IMPACT ON DIAGNOSIS. Remember that use of different formulas may decrease the diagnostic accuracy of the exam diagnosis (Impression), possibly causing significant errors that impact patient management.
HOW DOES A CLICKVIEW DEPARTMENTAL REPORTING SYSTEM WORK?
- CLICKVIEW is a central departmental database system that receives fetal biometric measurements from all US Carts in a department and uses standardized reference formulas to calculate uniform values for GA, FW, EDD, Percentiles of Fetal Growth, etc. for all Obstetrical reports
- CLICKVIEW receives fetal measurements from the US Cart but purposely bypasses individual US Cart calculated values for GA, FW, EDD and Percentile, etc. thereby eliminating the possibility of conflicting and incorrect reports resulting from US Carts which use different and conflicting formulas to calculate GA, FW, EDD, etc.
- CLICKVIEW calculations are visually plotted on Fetal Growth Charts in the report to show the progression of fetal growth through the pregnancy.
- Discrepancies occur when an US Cart uses different formulas to calculate OB values.
- The CLICKVIEW central departmental database improves the Quality of Patient Care by providing the referring physician with uniform standardized reports regardless of which US Cart in the department is used for the OB Exam.
FIGURE 1: HOW CLICKVIEW WORKS
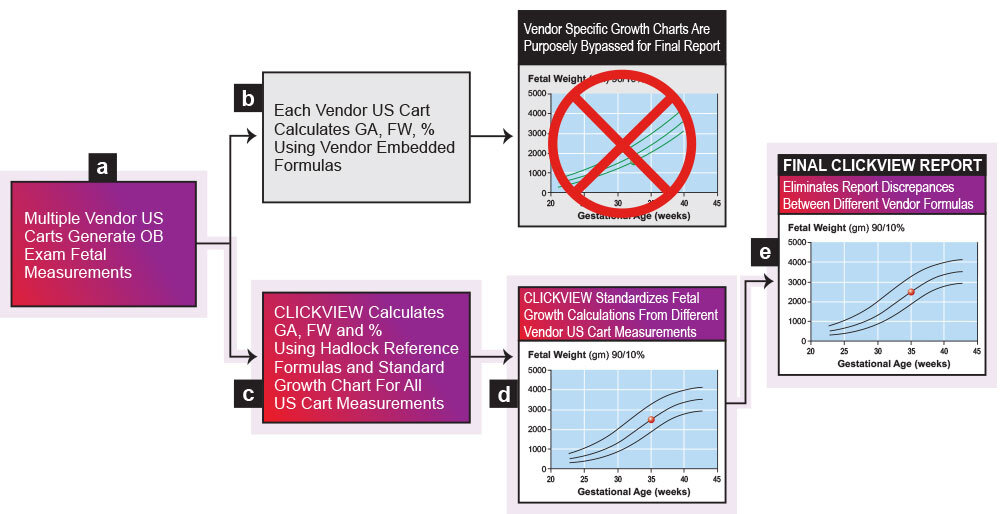
- CLICKVIEW database receives fetal measurements from all departmental US Carts.
- CLICKVIEW purposely bypasses US Cart GA, FW, Percentile, etc. calculations.
- CLICKVIEW database uses uniform Hadlock reference formulas to calculate GA, FW, Percentile, etc. values for all US Cart exam reports.
- CLICKVIEW Worksheet QA’s exam data values using reference Hadlock formulas. e. Fetal Growth Chart for the final report
QUICK REVIEW OF A BASIC FETAL GROWTH CHART
The basic Fetal Growth Chart (FGC) has only 4 components:
- A Fetal Gestational Age (GA) scale on the horizontal axis.
- A Fetal Weight (FW) scale on the vertical axis.
- A ‘Normal’ Fetal Growth Chart with three lines designating 90th Percentile, 50th Percentile, and 10th Percentile.
- Data Point indicating the fetal growth GA (35 wks.), FW (2500 gms.) and FW Percentile (50%) calculated for the fetus in this example.
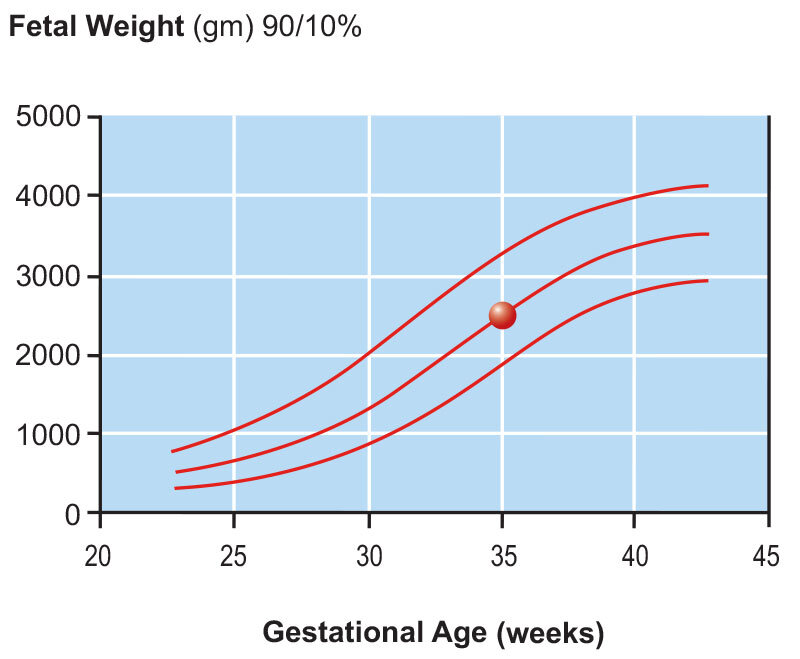
FIGURE 2. SAMPLE FETAL GROWTH CHART
(Please see Appendix for formulas and source reference articles.)
SIMPLE ENOUGH. WHAT COULD GO WRONG?
Not much. If we use the same growth chart and formulas to calculate Fetal Age and Fetal Weight for each exam for a fetus through the pregnancy.
THE MOST FAQS
The most Frequently Asked Questions (FAQs) our service and support team is asked are summarized below:
- Why do CLICKVIEW’s GA, FW or FW Percentile values differ from:
- My ultrasound cart?
- My old reporting system?
- The Fetal Growth Chart pinned to the wall of the ultrasound room.
IT’S THE US CART!
If US Carts use one or more different formulas from CLICKVIEW to calculate GA, FW, EDD, Percentiles, etc. these values will be different causing discrepancies. So, when we compare results between the CLICKVIEW Departmental system with those from an US Cart, there will be differences in the calculated values. It’s like comparing ‘apples to oranges’.
HOW TO FIND THE SOURCE OF THE DISCREPANCIES
When there are discrepancies in the US Cart calculated values for such as GA, FW, Percentile, and EDD, etc. in OB reports, it is important to be able to identify the source of the discrepancy.
- Begin by comparing the US Cart GA and FW, Percentile formulas with the CLICKVIEW Departmental system. This will determine if the same or different formulas were used to calculate the biometric values by the US Cart.
- If the formulas are different, then this is the reason for the discordant reports.
- This will also cause the calculated values and data plot point on the growth curve chart to be plotted incorrectly.
MAINTAINING QUALITY ASSURANCE
How to minimize discrepancies in OB reports:
- First, before calling CLICKVIEW, verify that all staff understand that the CLICKVIEW Departmental database formulas have been selected by Radiology Department Senior Management as the correct and preferred formulas for ALL Ultrasound departmental reports. Individual US Cart formulas that differ are purposely bypassed and thus are not the correct formulas.
- Second, Check each of the US Cart formulas even if they are all from the same vendor and especially from multiple vendors, or older model US Carts.
- Third, if in doubt, compare the authors of the formulas, the exact reference articles, and article publication dates. However, please keep in mind that:
- It is not unusual for research authors to publish multiple articles on the same subject. For example, Hadlock (alone) published over 50 articles and co-authored three books, with the main focus being updated formulas for fetal growth.
- When using Hadlock formulas, it is imperative to use an exact reference. Just stating that the vendor is using Hadlock is not acceptable.
- It is crucial to make sure that the reference articles are identical. For example, a Hadlock (1981) formula is very different from the Hadlock (1984) formula that is most commonly used today.
- Fourth, if the formulas and Growth Charts are identical, then the GA, FW, and weight percentiles should be an exact match in the reports.
- Finally, if the formulas and Growth Charts are identical, but there is a moderate to slight difference in the GA/ FW and percentiles, it may be necessary for the IT staff to contact the vendors with the following questions:
- Are the differences due to rounding errors in the formulas?
- Is it possible the original growth curves have been altered by post-processing to provide a smoother, sharper image?
IMPACT OF CHANGING FORMULAS ON FETAL GROWTH CHARTS
The following are examples of the impact of changing formulas and calculated values for GA, FW, Percentile growth on Fetal Growth Charts. (The sample baseline normal charts use Hadlock GA (1984), Hadlock FW (1984), and Williams Percentiles (1982))
WHAT HAPPENS IF THE GA FORMULA IS CHANGED?
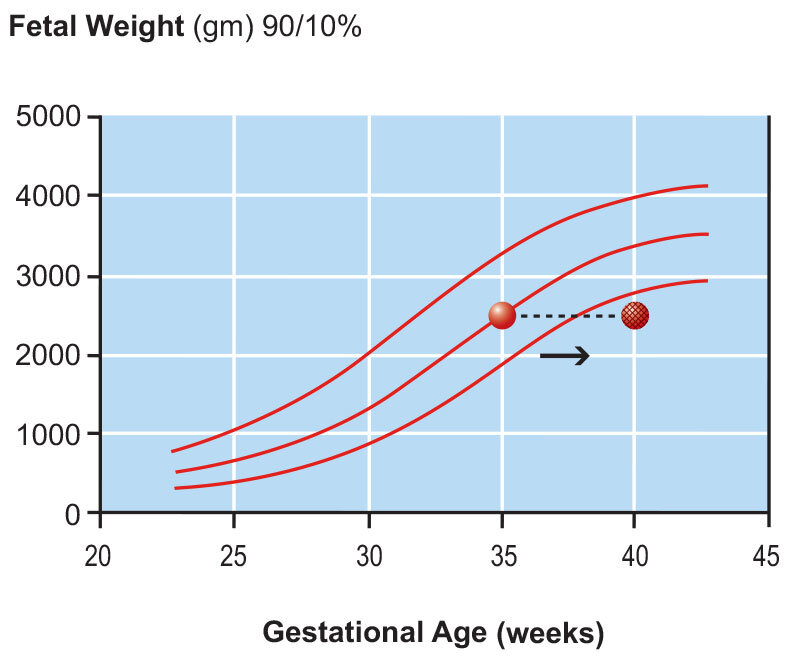
FIGURE 3. USING A DIFFERENT GA FORMULA
In this Figure 3, the Hadlock (1984) GA formula has been replaced by a formula from a different research article. However, the same FW formula is used, and the fetal measurements from Figure 1 are plotted on the same Williams ‘Normal’ Growth Chart.
- This new formula changes the Fetal Growth Chart in two ways:
- The calculated GA is changed from 35 weeks to about 40 weeks (full-term).
- The FW percentile changes from 50% at 35 weeks to less than 10% at full-term, which indicates IUGR.
- Again, a different GA formula could calculate a lower GA with the opposite effect of the FW being above the 90th percentile.
- IMPACT ON DIAGNOSIS: If the GA formula is changed in any way whatsoever, it can ultimately impact a patient’s care management plan.
WHAT HAPPENS IF THE FW FORMULA IS CHANGED?
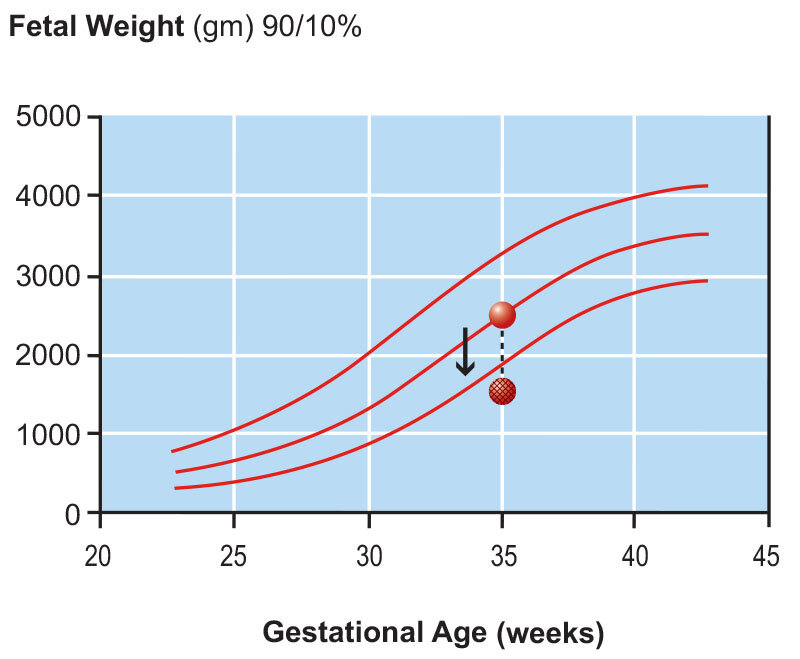
FIGURE 4. USING A DIFFERENT FW FORMULA
In Figure 4, the Hadlock (1984) FW formula has been replaced by a different formula from a research article. However, the same GA formula has been used, and fetal measurements from Figure 1 are plotted on the same Williams ‘Normal’ Growth Chart.
- This new formula changes the Fetal Growth Chart in two ways:
- The calculated FW is approximately 1500 grams, which is about 1000 grams less.
- The FW percentile for a 35-week gestation changes from 50% to less than 10%, which indicates IUGR.
- On the other hand, a different FW formula could have the opposite effect and calculate a higher FW that is above the 90th percentile.
- IMPACT ON DIAGNOSIS: If the FW formula is changed in any way whatsoever, it can also significantly impact a patient’s management plan.
WHAT HAPPENS IF A DIFFERENT GROWTH CHART IS USED?
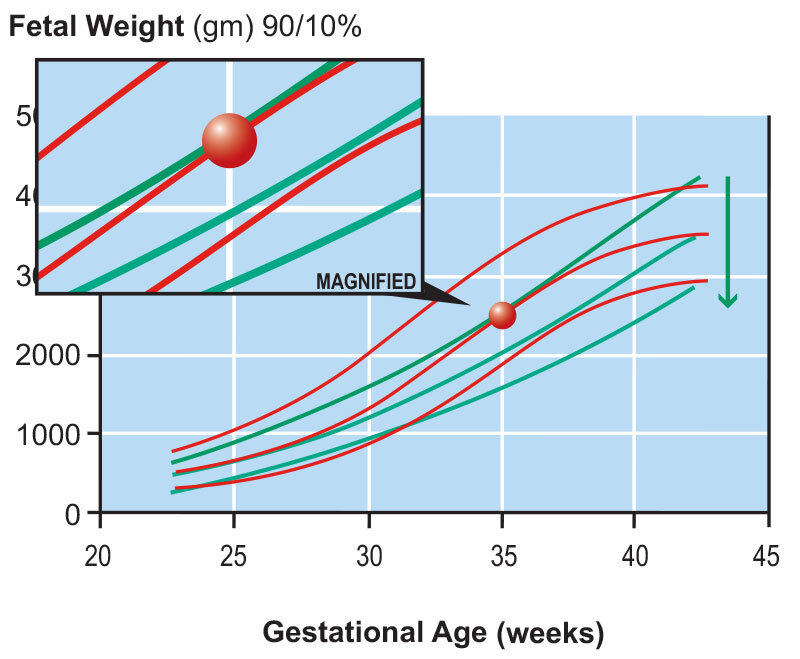
FIGURE 5. USING A DIFFERENT FETAL GROWTH CART
In Figure 5, the chart shows what happens when a different Fetal Percentile growth formula is used for the same fetal measurements in a CLICKVIEW sample report. The chart reads as follows:
- The red lines indicate the standard CLICKVIEW calculation when using the Williams formulas.
- The green lines indicate different Fetal Percentile growth formulas which have been superimposed over the red lines of the Williams formulas to demonstrate the impact of changing the Fetal Percentile growth formulas.
- The discrepancy is quite apparent in this example:
- The 90th, Mean and 10th percentiles have now shifted to lower values throughout the term of the pregnancy, except at full-term.
- The overall shape of the growth curve has also changed.
- IMPACT ON DIAGNOSIS: If the Fetal Growth Chart is changed in any way whatsoever, it can also significantly impact a patient’s management plan.
APPENDIX: STANDARD CLICKVIEW FORMULAS
- Gestational Age: (Hadlock, Radiology 1984; 152: 497-501) GA = 10.85 + 0.60 (HC) (FL) + 0.6700 (BPD) + 0.1680 AC
- Fetal Weight: (Hadlock, Radiology 1984; 150: 535-540) Log10 BW = 1.5115 + 0.0436 (AC) + 0.1517 (FL) – 0.00321 (AC x FL) + 0.0006923 (BPD x HC)
- Normal Fetal Growth Curve: Williams, RL, et al. Obstet Gynecol 1982; 59: 624